Spreadsheets
The EIM Version 5 Spreadsheet Set is a collection of enhanced tools designed to help organizations maximize the productivity and profitability of their investment in inventory and implement the principles of effective inventory management. The enhanced EIM Forecasting/Analysis Spreadsheet combines the analysis performed by several of our individual spreadsheets into one! It allows you to analyze up to 100 items at a time just by loading your data into a single worksheet.
The EIM Version 5 Spreadsheet Set contains:
- The Enhanced EIM Forecasting/ Analysis Spreadsheet
- EIM Forecasting/Analysis Spreadsheet Set Version 5 Documentation. This Word document contains all instructions and visuals for all 11 spreadsheets.
- Ten Additional Excel® spreadsheets:
- Price Break by Item
- Price Break by Vendor Line
- Price Break (freight allowance and terms)
- Value of Lost Material
- Vendor Rebate Analysis
- Replenishment Parameter Analysis
- Price Increase Analysis (how much of a product to buy before a vendor price increase)
- Cost of Filling Orders
- Inventory Carrying Cost (K Cost) and the Cost of Replenishing Inventory calculators
- Landed Cost Worksheet
The EIM Version 5 Spreadsheet Set — Features
- Identify unusual usage
- Forecast future demand of products using the best of nine different formulas
- Compare results of safety stock quantities calculated using different methodologies
- Determine proper minimum and maximum quantities for items with sporadic usage based on a multiple of the normal quantity sold or used in one transaction
- Analyze vendor price break based on individual items, product lines and vendor rebate offers
- Analyze replenishment parameters
- Understand how buying vendor package quantities affects profitability
- Perform a comprehensive inventory analysis for individual items
- Understand inventory management terms with a comprehensive glossary (located in the Word Documentation file)
- Calculate landed costs for each item on a stock receipt
- Calculate your carrying cost percentage and cost of replenishing inventory amount
- Calculate your cost of filling a customer order
- Calculate how much material to buy before a price increase
- And much more…
Currently Using The EIM Version 4 Spreadsheets?
How are Version 5 Spreadsheets improved?
- New graphical displays and override capabilities for your current spreadsheets
- Enhanced functionality for “what if” analysis in the Forecast Analysis spreadsheet
- A “Stock Test” that will identify those items that are not sold or used often enough to meet your designated stocking criteria
- A new spreadsheet that allows you to calculate landed costs for received items
- A new spreadsheet that will help you analyze calculated replenishment parameters
- New spreadsheets for calculating:
- Cost of carrying inventory
- Cost of replenishing inventory
- Cost of filling a customer order
- A new spreadsheet for analyzing how much to buy before a vendor price increase
ORDER NOW
The spreadsheet templates, instructions, and visuals will be delivered to you electronically.
Order online at the Online Store or you can fax the order form to our secure fax at 972.393.1310. If you have any questions, contact us at 972.304.3325 or email maureen@effectiveinventory.com
Details By Spreadsheet
The Enhanced EIM Forecasting/Analysis Spreadsheet:
Perform forecasting analysis on up to 100 items at a time by just loading your data into one single worksheet. With one data entry action, automatically populate data and calculation fields on several worksheets.
Areas of analysis include:
- EIM Forecasting-Analysis Spreadsheet:
- Differentiate types of usage.
- For items with recurring usage:
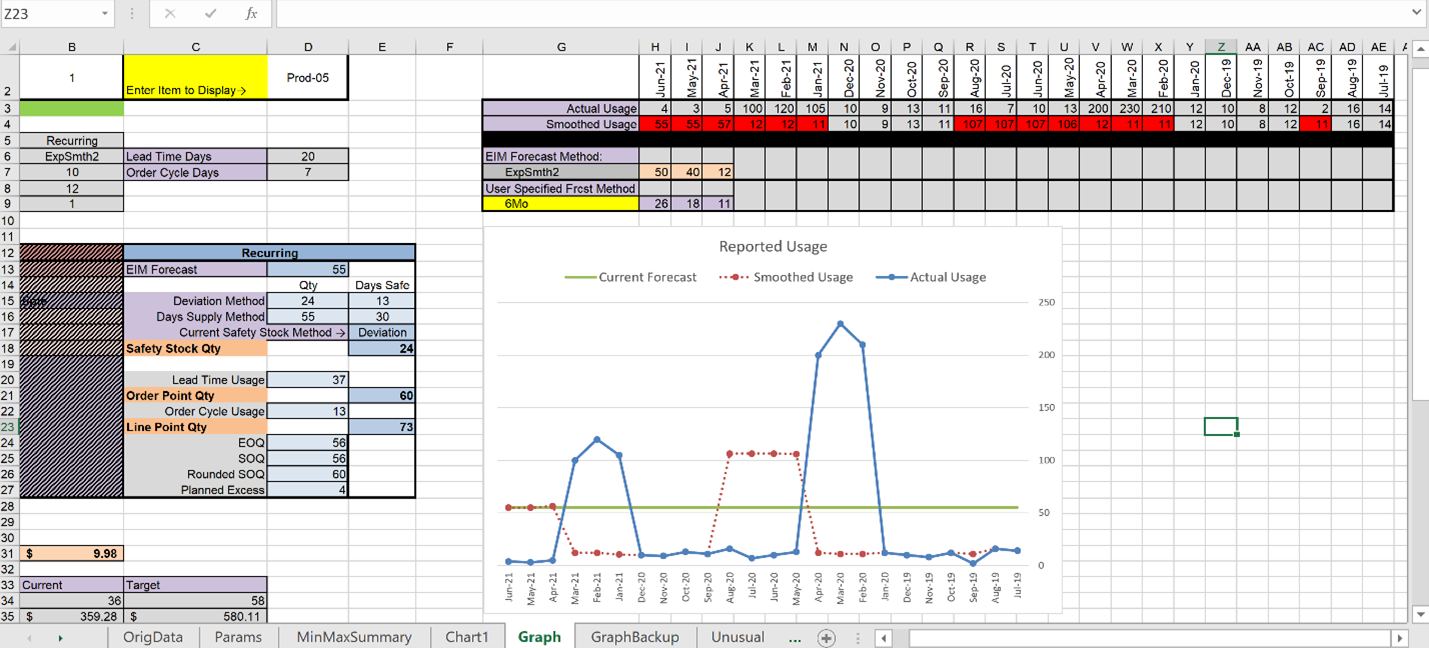
- Identify the best forecast formula from nine methods preloaded into the spreadsheet
- Calculate safety stock quantities using either the “day’s supply” or “average deviation” methods and see the resulting effects on the projected customer service level and inventory investment
- Calculate the forecast and suggested replenishment parameters:

- For items with sporadic usage:
-
- Calculate normal quantity sold/used in one transaction. Utilize this quantity to calculate minimum and maximum stock levels based on order frequency, anticipated lead times and the cost of the normal quantity sold used in one transaction. The worksheet displays the projected customer service level and inventory investment.

- Compare your current inventory value, turnover and return on investment to potential “ideal” values. You can then see how varying safety stock and other parameters affect your service level and inventory investment:

- Employ user-maintained controls to smooth out unusually high or low usage resulting in more accurate forecasts of future demand.

- Explore how each element used to calculate replenishment parameters for an item is utilized in determining when to reorder a product and how much to order:
- Compare the current and potential values of these key metrics:
-
- Inventory turnover
- Turn/earn index
- Gross margin return on investment
- Adjusted gross margin (i.e., gross margin considering your average inventory investment)
- Percentage of excess inventory
- Planned excess (i.e., what vendors force you to buy in excess of what you need)
Worksheets that allow you to perform “what if” analysis:
- The effect on adjusted margins with changes to sales, cost of goods sold and inventory values
- Different variables effect on the calculation of economic order quantities
- What happens when you change the rules concerning when products will be stocked
- How changing anticipated lead times, order cycles and safety stock quantities affect replenishment parameters
The new EIM Version 5 Spreadsheet release also includes the following spreadsheets to enhance your inventory analysis and replenishment decisions:
- Price Break by Item
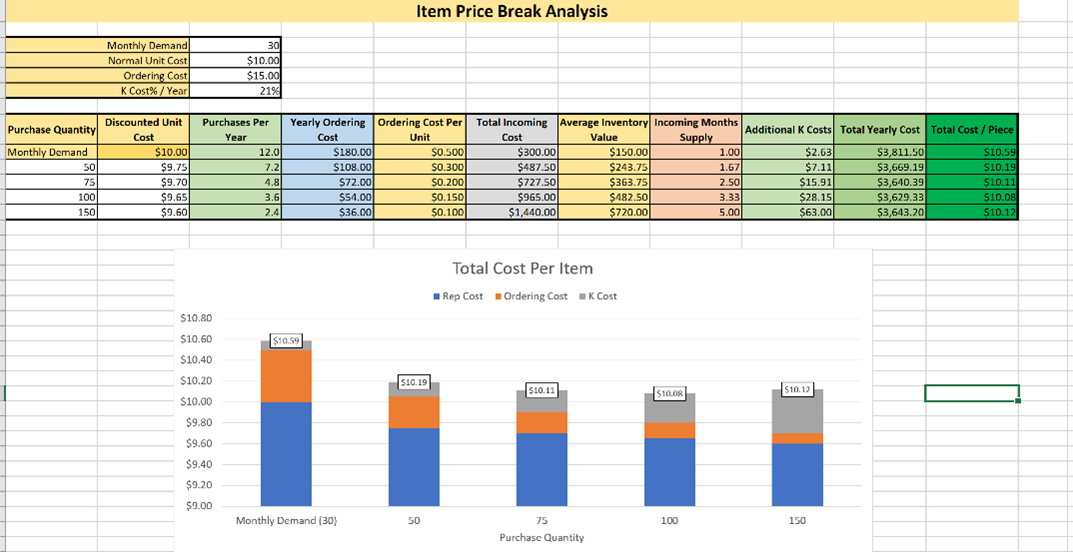
If a vendor offers you a lower price per piece for a larger purchase quantity, is it a good deal? This spreadsheet helps you make an intelligent decision. It compares the lower cost per piece to the cost of carrying inventory for a longer period of time. It also takes into account the lower reordering cost per unit resulting from the purchase of larger quantities. The price break that provides the lowest Total Cost/Piece (last column) represents the best buy quantity.
- Price Break by Vendor Line
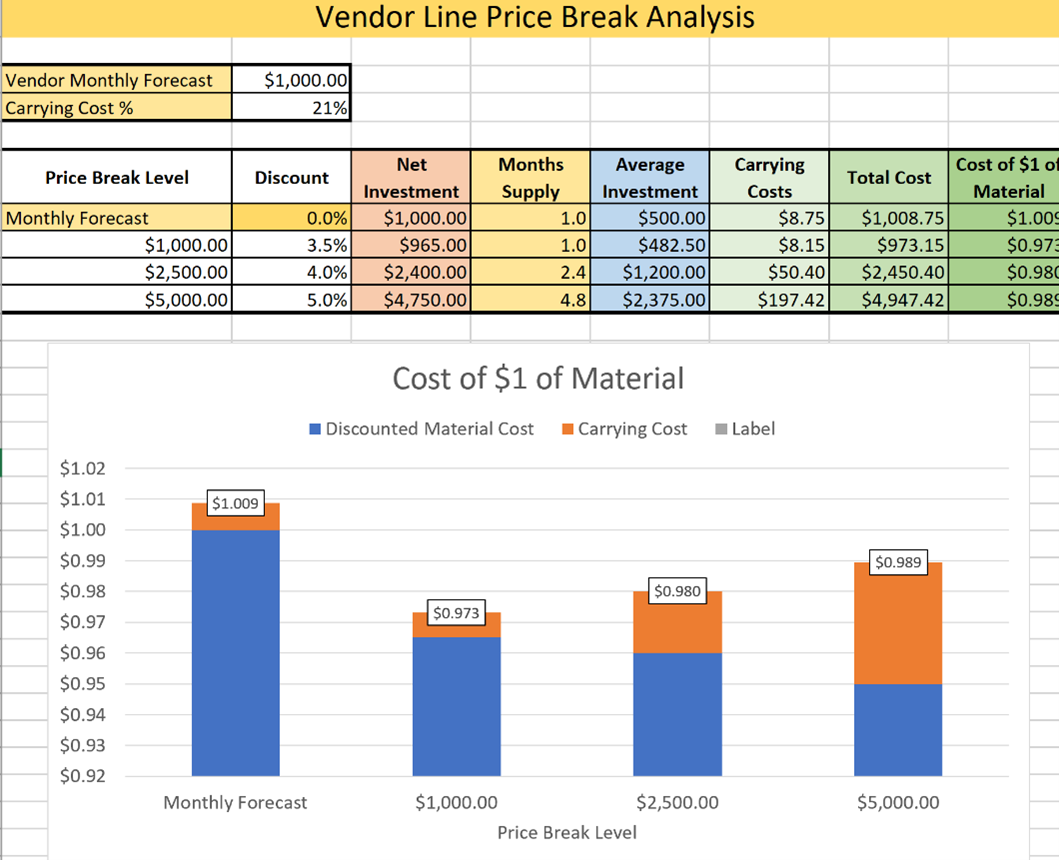
Compares the discount you receive to the cost of carrying each purchase quantity for the length of time necessary to sell the entire amount (based on your current overall forecast for the vendor line). The result is a calculation of how much each dollar’s worth of inventory costs when you consider both the discount and the carrying cost. The lower the cost of a dollar’s worth of material, the better the deal.
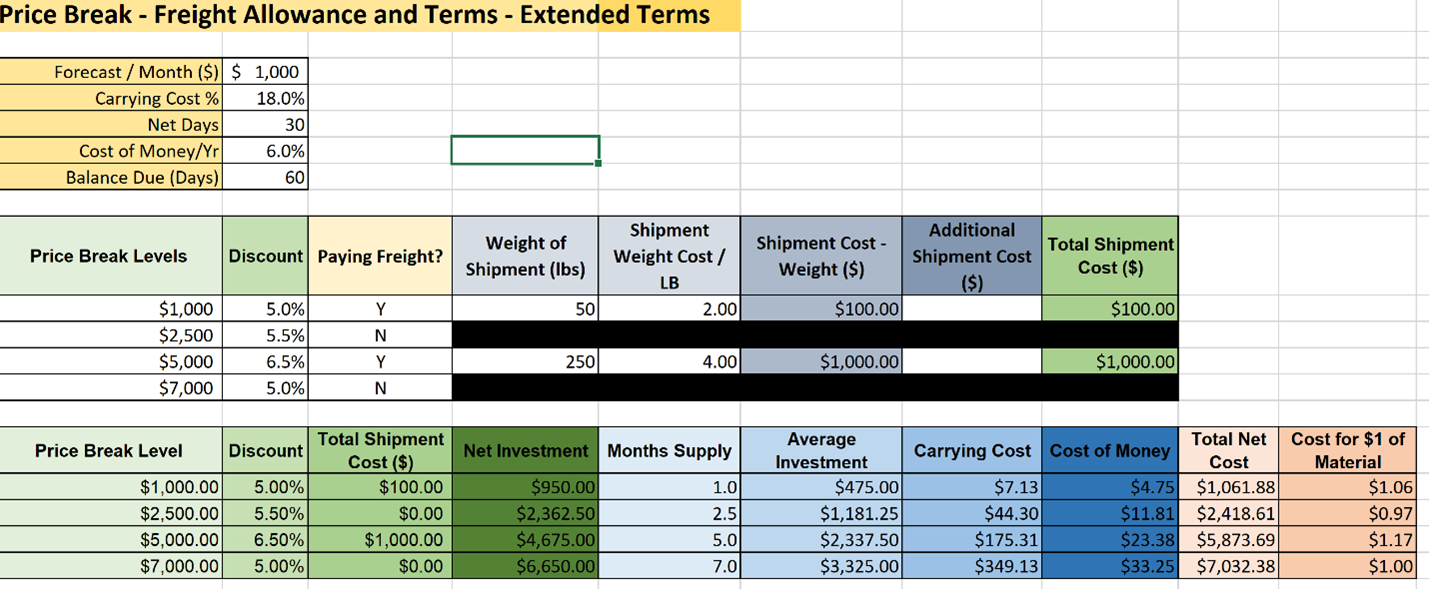
- Price Break with Freight Allowance and Terms
Allows you to consider freight, terms discounts, and extended terms in deciding which of three entered purchase quantities represents your “best buy” quantity.
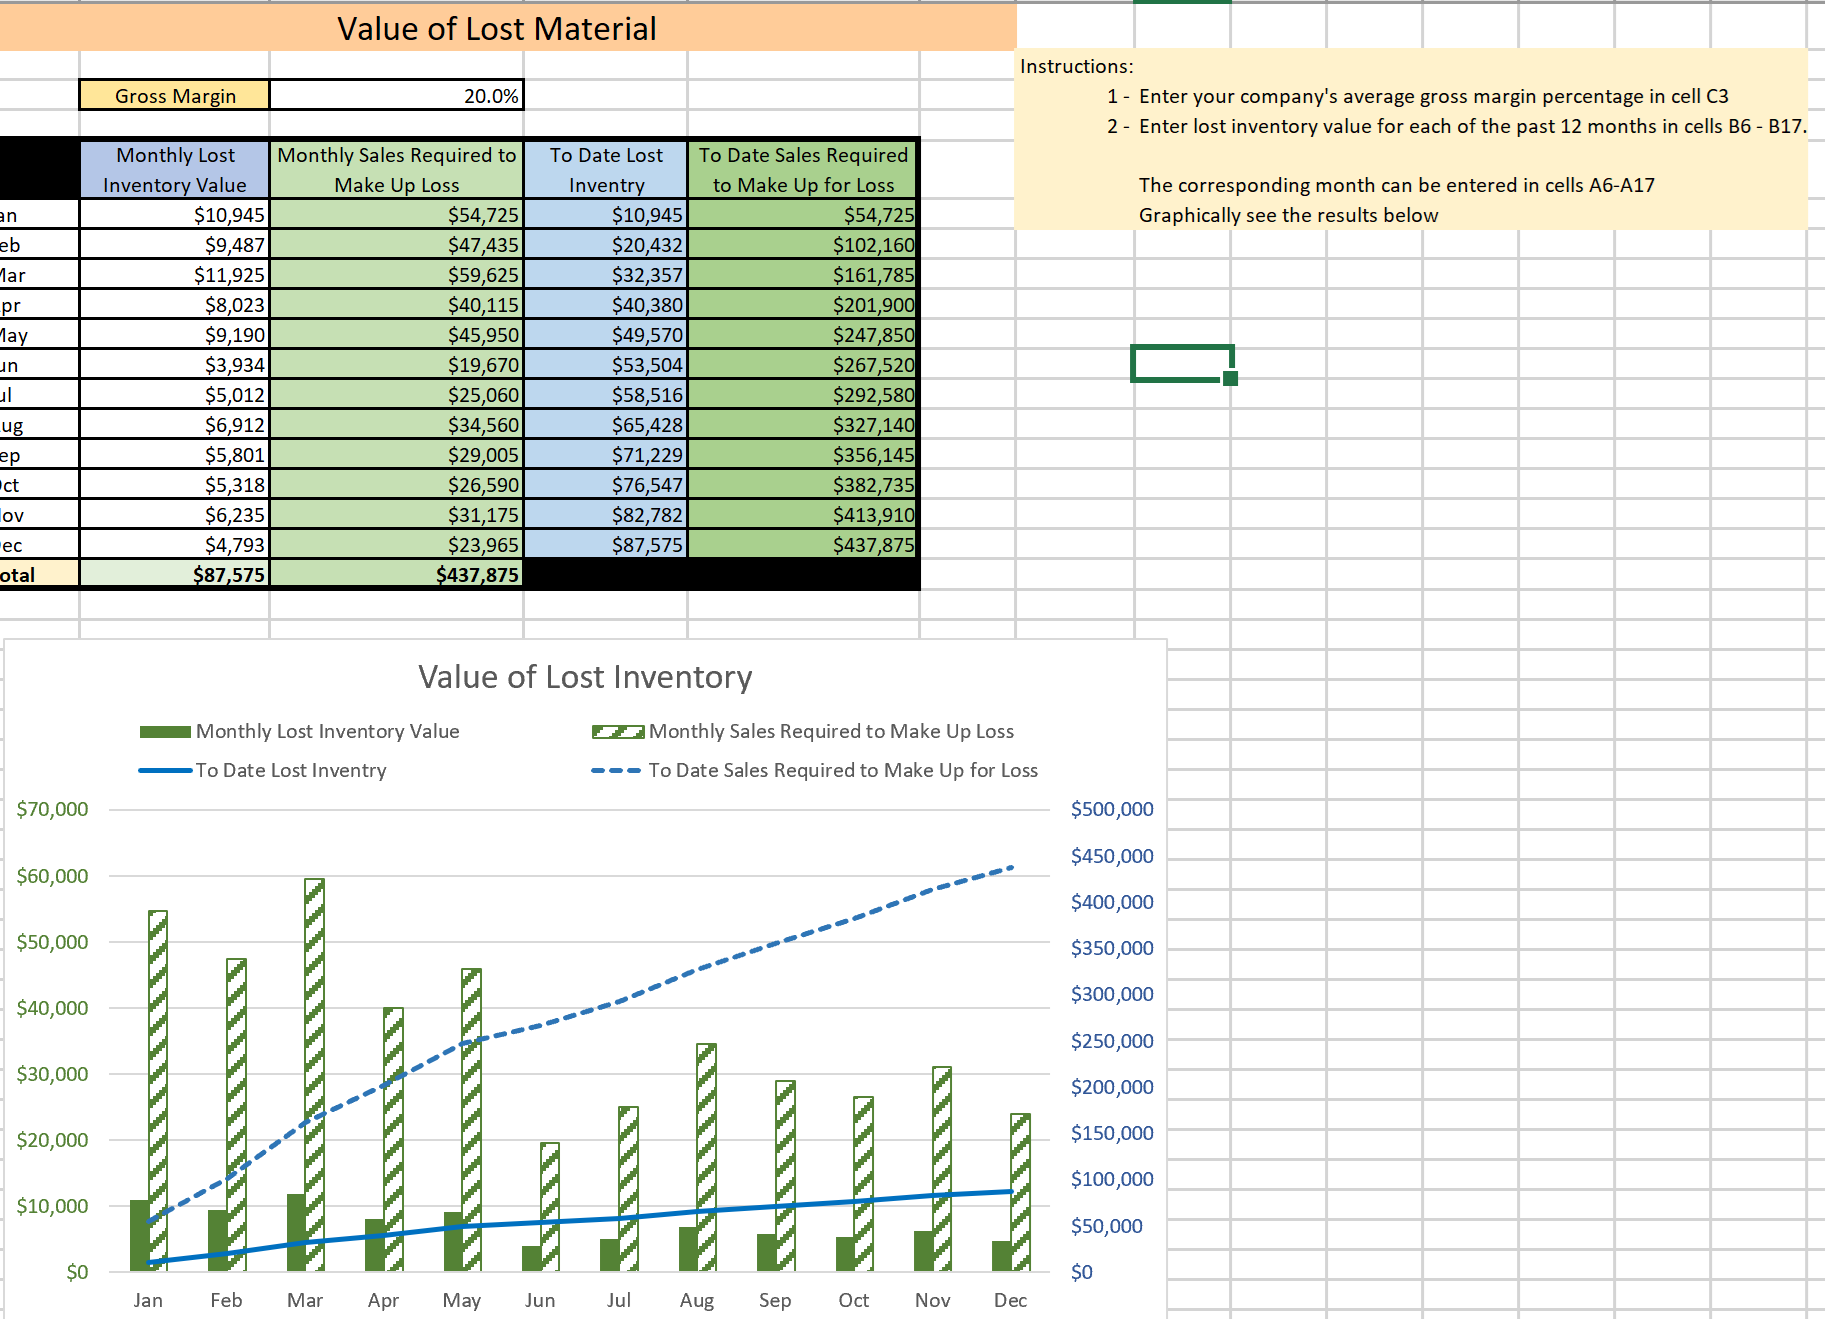
- Value of Lost Material
Determines the amount of additional sales your company must generate to make up for the value of material that was lost, stolen, or is otherwise unusable.
- Rebate Analysis
This spreadsheet helps you determine if it is advantageous to order additional inventory to qualify for an annual rebate offered by one of your vendors:

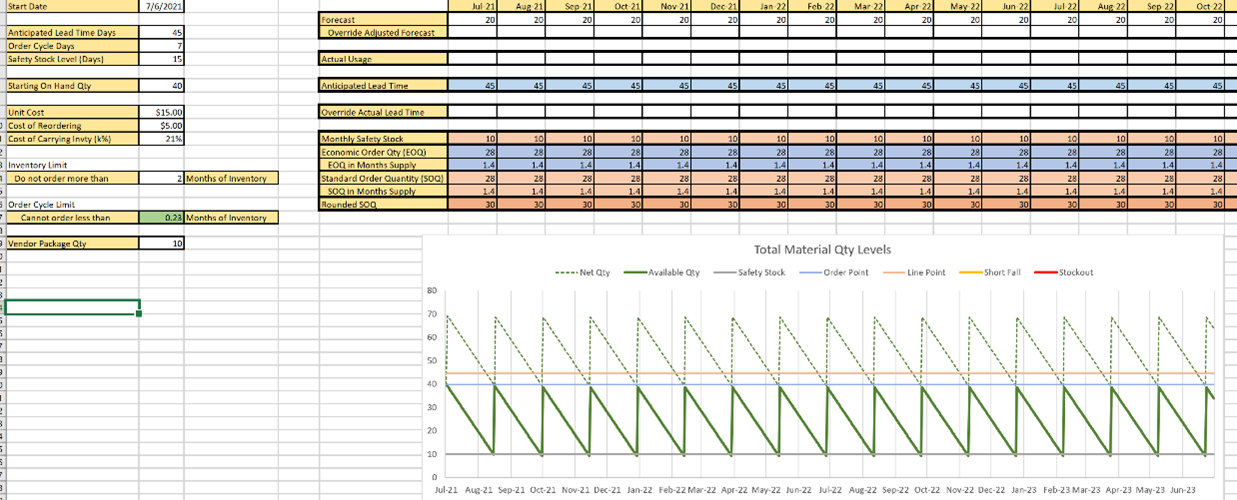
- Replenishment Parameter Analysis
This spreadsheet demonstrates how changing certain replenishment parameters will affect other parameters as well as your overall stock level of an item:
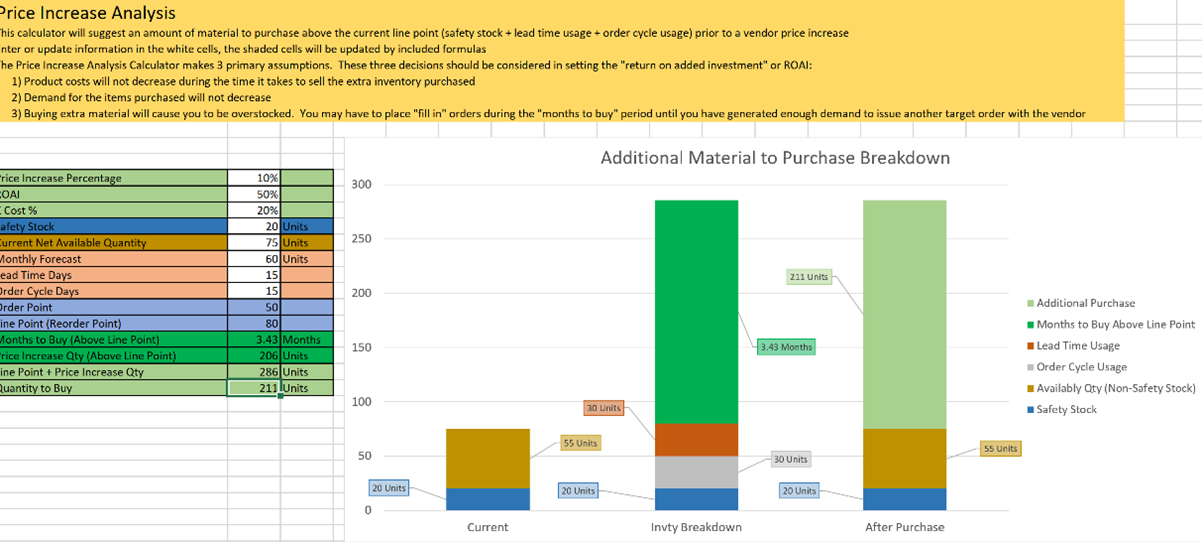
- Vendor Price Increase Analysis
This spreadsheet guides you in deciding how much additional inventory of a product to order in anticipation of a vendor price increase:
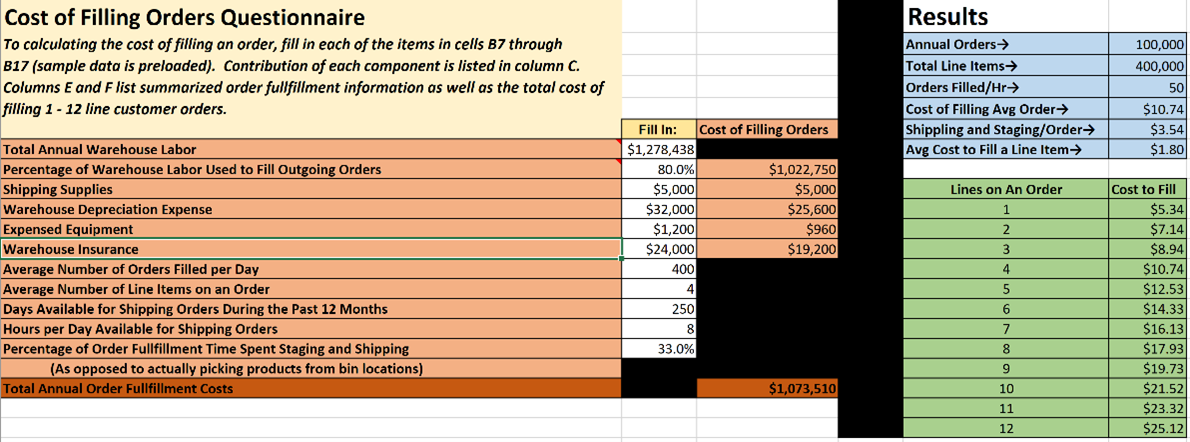
- Cost of Filling an Order Calculator
This spreadsheet helps you determine how much it costs you to fill a customer order:
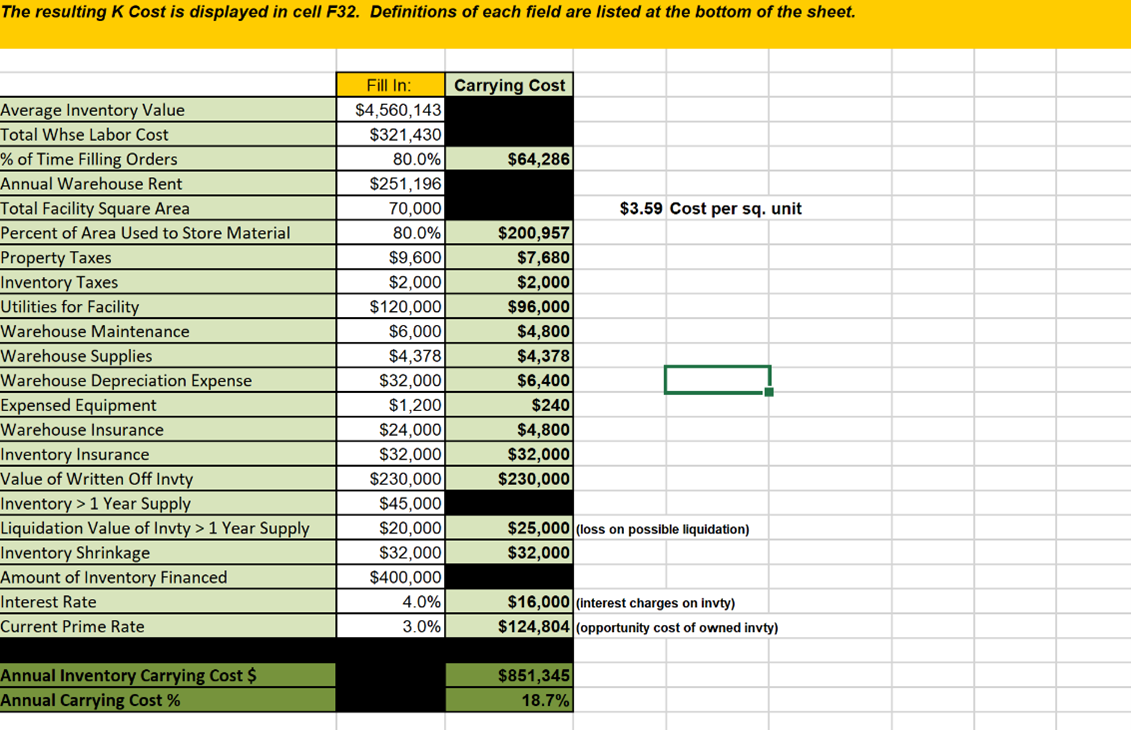
- Cost of Carrying Inventory Spreadsheet
This spreadsheet calculates how much it costs to maintain inventory in your warehouse. That is, how much does it cost you to maintain a dollar’s worth of inventory in your warehouse for an entire year. This is valuable information for calculating accurate economic order quantities and is also used in profitability analysis:
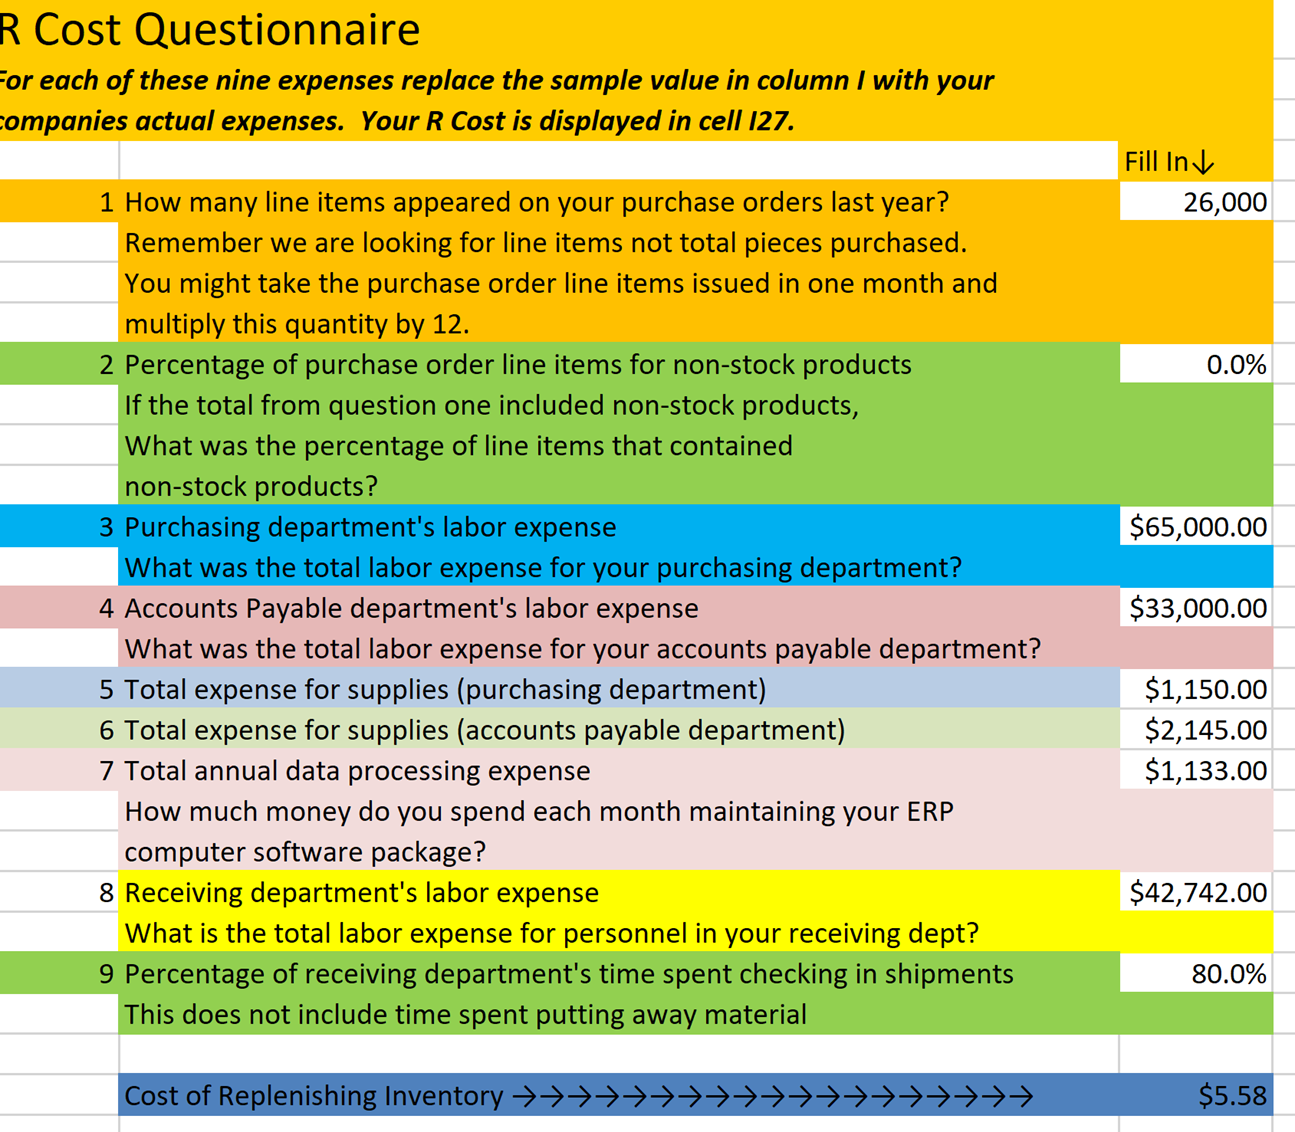
- Cost of Replenishing Inventory
This spreadsheet allows you to determine how much it costs for you to issue and receive a purchase order line item from a vendor. It is valuable information for calculating accurate economic order quantities:
- Landed Cost Spreadsheet
This spreadsheet allows you to add freight charges, customs duties and other charges associated with incoming shipments to the vendor cost to determine the landed cost of each received item. Information for up to 100 line items can be entered at one time.

- Each spreadsheet template uses usage and other data you input or download from your computer system to provide you with the guidance you need to maximize the profitability and productivity of your inventory investment.
- Please contact us for more information on how we can customize these spreadsheets for your organization.
